Project Overview
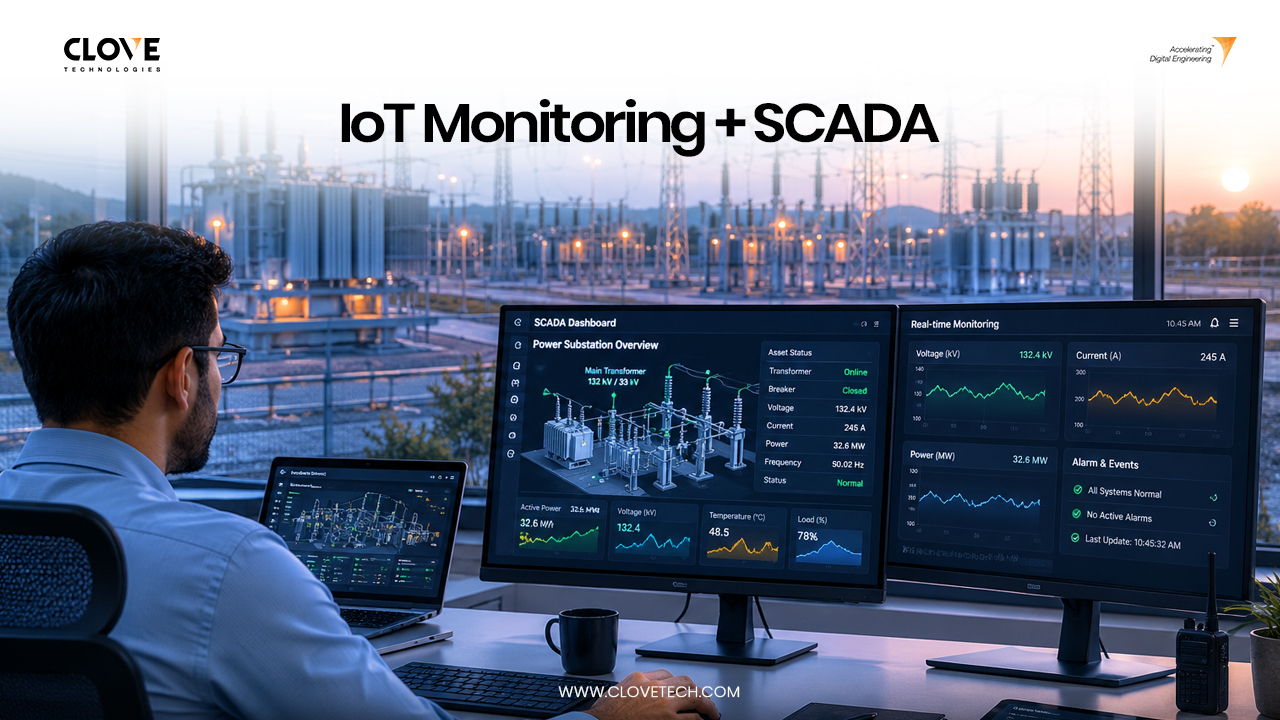
TSNPDCL connected IoT sensors and SCADA data to its substation Digital Twin in Warangal, turning a static 3D model into a real-time monitoring environment giving operations and engineering teams a single view of equipment status, conditions, and alarms instead of switching between disconnected systems.
PROJECT INFORMATION:
| Client: | Telangana State Northern Power Distribution Company Limited (TSNPDCL) |
| SERVICE: | IoT, SCADA |
| INDUSTRY: | Power Distribution / Utilities |
Software Used:
De-Risking Asset Operations: How Real-Time Digital Twins Support Executive Decision-Making
Telangana State Northern Power Distribution Company Limited (TSNPDCL), a power distribution utility operating substations in Warangal, needed more than a visual reference of its facility it needed to see how that facility was actually performing, in real time. Its existing Digital Twin provided an accurate 3D representation but carried no live operational data, while SCADA and sensor data remained locked in separate control-room interfaces. Clove Technologies designed and implemented an integrated environment connecting IoT sensors, SCADA systems, and the Digital Twin, mapping live equipment data to its precise spatial and asset context. The result was a single connected environment where operations, engineering, and facility teams could monitor equipment status, environmental conditions, and alarms directly within the digital model reducing the need to cross-reference multiple systems and enabling faster, better-informed operational decisions.
The Operational Challenge: When a Digital Twin Isn't Enough
For TSNPDCL, the Digital Twin of its substations had become a valuable asset in its own right but it told only half the story. The model showed switchyard layout, equipment placement, and substation geometry accurately. It did not show what those transformers, breakers, and feeders were actually doing at any given moment.
This gap is common across power distribution operations, and TSNPDCL’s challenges reflected several of the same underlying issues:
- Static 3D substation models without live operational information. The Digital Twin reflected how each substation was built or designed, not how it was currently performing.
- SCADA data existing separately from asset visualization. Operators monitored transformer loading, breaker status, and feeder conditions through SCADA screens with no spatial or visual context connecting a tag or alarm to its physical location within the substation.
- Sensor data difficult to interpret in physical context. Raw values from [Sensor Type] devices meant little without knowing precisely which transformer, bay, or feeder they belonged to.
- Limited visibility into asset condition. Teams often relied on periodic manual inspections or historical logs rather than a continuous, current view of equipment health across substations.
- Delayed identification of abnormal conditions. Because monitoring was siloed, unusual readings or alarms such as transformer overloading or abnormal temperature rise could go unnoticed until they escalated into larger operational issues.
- Difficulty correlating alarms with physical assets. An alarm in SCADA required manual cross-referencing against single-line diagrams or asset registers to locate the affected equipment within a given substation.
- Multiple systems, multiple interfaces. Operations and engineering teams had to move between SCADA dashboards, spreadsheets, and the 3D substation model separately, slowing down response and decision-making a particular challenge when monitoring assets across multiple substation locations.
The core issue was clear: having a Digital Twin, or having SCADA and IoT data, was not enough on its own. Without integration, each system offered only a partial and disconnected view of substation performance.
Clove Technologies Closed the Gap Between Data and Visualization
Clove Technologies designed a connected data environment that linked the physical asset layer to the Digital Twin through a structured integration path:
IoT Sensors → Equipment → SCADA → Digital Twin
- Sensor data capture: The devices installed on or near critical equipment continuously captured parameters such as temperature, pressure, vibration, and status.
- Equipment data collection: Data from individual equipment units was aggregated at the control and monitoring layer, preserving the identity and location of each data source.
- SCADA operational visibility: The existing SCADA system continued to provide real-time control-room visibility into process and equipment status, serving as a primary operational data source.
- Mapping live data to assets: Clove Technologies mapped each SCADA tag and sensor data stream to its corresponding asset object within the Digital Twin, establishing a persistent link between physical equipment and its digital representation.
- Spatial and asset context: The Digital Twin provided the spatial framework where each asset sits, how it relates to adjacent systems, and how it fits within the facility as a whole.
- Unified access: Users could then access live operational information directly within the digital environment, without switching between SCADA screens, spreadsheets, and 3D models.
The underlying principle guided every design decision: a Digital Twin becomes intelligent when it is connected to what is happening in the physical asset. A model without live data is a static reference. A model with live, mapped data becomes an operational tool.
The Architecture Behind the Connected Digital Twin
Physical Asset Layer This is the actual equipment, infrastructure, or facility being monitored. It is the source of all operational behavior the system is designed to capture.
Sensors & Equipment: Instruments and equipment-level controllers generate the raw data temperature, pressure, vibration, status, and other operating parameters at the point of origin.
IoT / Edge Data Collection: Edge devices or gateways collect sensor and equipment data locally, performing initial validation and preparing it for transmission to upstream systems.
SCADA / Control Systems: SCADA aggregates equipment and process data, provides operator-level control and alarm management, and serves as a structured, real-time operational data source.
Data Integration Layer: This layer normalizes data from SCADA and IoT sources into a consistent format and structure, resolving differences in tagging, units, and update frequency so the data can be reliably consumed downstream.
Digital Twin Platform: The Digital Twin hosts the spatial and asset model of the facility. Integrated data is mapped to the corresponding 3D asset objects, giving each data stream a physical location and identity within the model.
Visualization & Monitoring: Users interact with the connected environment through dashboards and the 3D interface, viewing live status, trends, and alarms in the context of the physical layout.
Operational Decision Support: With live, contextualized data available in one place, operations and engineering teams can assess conditions, prioritize responses, and make decisions faster and with greater confidence.
Data flows continuously from the physical layer upward: sensors and equipment generate readings, edge and SCADA systems structure and transmit them, the integration layer normalizes them, and the Digital Twin renders them in spatial context for the end user.
How Clove Technologies Delivered the Integration, Step by Step
Step 1 Asset and system assessment: Clove Technologies reviewed the facility’s existing assets, SCADA architecture, and any prior Digital Twin or BIM models to understand the current state and integration readiness. This step ensures the solution is designed around the client’s actual infrastructure rather than a generic template.
Step 2 Sensor/data source identification Relevant sensors, equipment tags, and SCADA data points were identified and catalogued. Correctly scoping data sources at this stage prevents gaps or redundant monitoring later in the project.
Step 3 IoT and SCADA integration Data pathways were established between IoT devices, SCADA systems, and the integration layer. This connects previously siloed systems so their data can be consumed centrally.
Step 4 Data normalization and mapping Incoming data was standardized in format, units, and naming conventions. Consistent structure is essential for accurate downstream visualization and analysis.
Step 5 Asset-data association Each data stream was linked to its corresponding physical asset in the Digital Twin’s asset register. This step is what allows a sensor reading to be understood as belonging to a specific piece of equipment, not just a number in a database.
Step 6 Digital Twin integration Normalized, mapped data was connected to the Digital Twin platform, enabling live values to populate the corresponding 3D asset objects. This transforms the model from a static reference into a live representation.
Step 7 Real-time visualization Dashboards and 3D views were configured to display live equipment status, conditions, and trends in an intuitive, spatially organized format for operations and engineering teams.
Step 8 Alarm and anomaly monitoring Alarm thresholds and abnormal condition indicators were configured within the connected environment, so deviations are visible directly in the context of the affected asset.
Step 9 Validation and deployment The integrated environment was tested against known operating conditions to confirm data accuracy and reliability before being handed over for operational use.

What the Digital Twin Enabled
Within the connected environment, users could monitor, where applicable to the project scope:
- Equipment status
- Temperature
- Pressure
- Vibration
- Energy consumption
- Environmental conditions
- Alarms
- Events
- Operating conditions
This gave teams a clearer, more structured way to understand their assets:
- WHAT is happening? Live parameter values and alarm states, visible without needing to interpret raw SCADA tags.
- WHERE is it happening? Precise spatial location within the Digital Twin, removing the guesswork of manually locating an asset from a tag ID.
- HOW is the asset performing? Trends and current conditions viewed in context, supporting a more informed read on equipment health and behavior.
SCADA + Digital Twin: Why the Integration Matters
|
Each system is valuable independently, but each also has a natural limitation. SCADA tells operators that something is happening; the Digital Twin tells them where it is happening. Integrating the two supported by continuous IoT data closes the gap between operational awareness and spatial understanding, giving teams a single, coherent picture instead of three partial ones.
Operational Impact and Business Value
In day-to-day operations, the connected environment gives TSNPDCL teams continuous visibility into substation performance from real-time equipment status and condition monitoring (temperature, pressure, and vibration trends) to alarm and event detection located directly within the digital environment. Abnormal conditions can be identified sooner, remote assessments reduce the need for physical site visits, and energy consumption and equipment performance can be tracked against expected norms all of which feed directly into maintenance and operational decision-making. While this implementation centers on real-time monitoring rather than predictive analytics, the same data foundation lays the groundwork for future predictive maintenance capabilities as the project scope evolves. The impact is evident in how teams now work: a single, consolidated view of substation status has replaced manual cross-referencing across SCADA screens, spreadsheets, and static models, and alarms are now easier to locate and interpret in their physical context supporting faster, better-informed decisions.
The Real Value of a Connected Digital Twin
The shift is best summed up simply: a 3D model shows what an asset looks like, while a connected Digital Twin shows what the asset is doing. For TSNPDCL, that means moving from disconnected systems and static models to a live, integrated environment from manual interpretation and delayed issue identification to real-time, asset-level context and faster response. This is the value a connected Digital Twin brings to infrastructure owners and engineering leaders: not just a better-looking model, but a working operational tool. Ready to connect your assets to live operational intelligence? Let Clove Technologies help your Digital Twin go beyond geometry so your team sees what’s happening, not just what it looks like. Talk to Our Digital Twin Team.